
Digital Fleets
A design tool for engineers to integrate Zero-Emission Vehicle (ZEV) solutions into blueprints and estimate construction costs

BACKGROUND
Zero-emission vehicles (ZEVs) aim to replace gas-powered cars and reduce harmful environmental impact.
Digital Fleets, a SaaS platform by EquiCharge, one of North America's largest electric vehicle fleet operators, leverages data analytics and AI to streamline ZEV planning, design, and operation, facilitating a faster and more efficient transition to electric vehicles.
MY ROLE
As a lead product designer, I created a technical drafting tool with AI-assisted features for the Digital Fleets platform, enabling engineers to manage EV transition scenarios, create construction-ready blueprints, and estimate costs. On this project, I collaborated with a team of engineers and other designers.
OUTCOMES
40% reduction in costs 👉 More junior staff, faster work processes, and the integrated scenario planning and design features.
3x faster work 👉 Automated design generation process and centralized knowledge repositories.
50 % client increase 👉 More value to design engineering firms and a new client base on top of fleet operators.
PROBLEM SPACE
Expensive, Time Consuming, and Prone to Errors Design and Estimation Process
Designing a typical Zero-Emission facility and preparing it for construction is usually complicated. Engineers have to switch between different design, optimization, and cost analysis tools which makes the process expensive, time-consuming, and prone to mistakes.

Goals
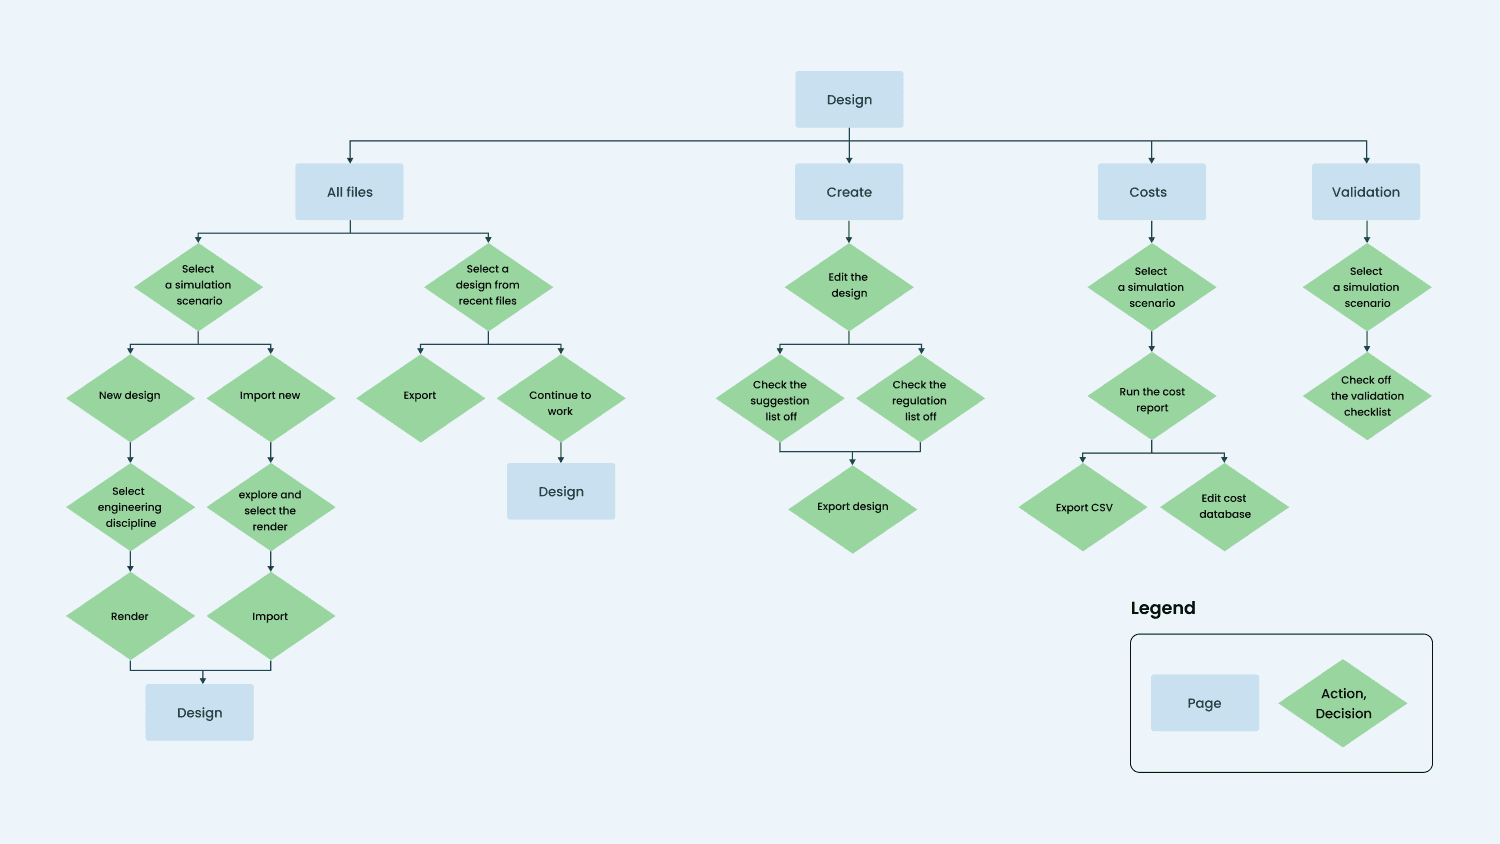
Developing a new module named Design within the Digital Fleets platform to
make the design process quicker, more consistent, and reliable.
enable junior design engineers to educate themselves following the AI recommendations.


UX PLAN
Developing an AI-Assisted Design Workspace
At the beginning of this UX design journey, the leadership tasked us with creating an all-new feature known as the AI Design Workspace, a platform for design engineers to create blueprints for their EV transition solutions. This feature allows engineers to run a cost analysis on their projects and also has integrated AI suggestions to make their designs more efficient.
Based on our team’s findings, we identified the following key needs:
-
Creating the Design module by selecting design, optimization, and cost analysis tools and make the design process more efficient.
-
Allowing multiple engineers to create, import, and edit designs together in real-time to make the design process quicker and more consistent.
-
Creating the design tools inspired by AutoCAD to ensure the final design is consistent with standards, and HR staffs know how to use it.
-
Making an AI generated checklist to identify any errors and help junior design engineers complete the design successfully.
-
Creating a step-by-step guidance checklist to help junior design engineers to follow regional, national, and international regulations.
-
Implementing tools for engineers to validate designs and exchange feedback to make the final design reliable and consistent.
-
Designing a cost report dashboard to make the project development more efficient.

02 TECHNICAL EXPLORATION
Designing the User Flow
After defining the UX plan, as part of our technical exploration we followed the following steps:
Holding meetings with engineering to define the AI design workspace workflow.
Conducting workshops to define core flows for creating and importing designs.
Collaborating with engineering and product management to optimize user experience flows to guide the design process.
Initial flow

Optimized flow

03 SKETCH
Visualizing Ideas via Sketching
At this stage, our team distributed the tasks, and I took charge of the All Files, Create, and Costs pages. Based on the requirements, optimized flow, and initial inputs, I sketched different iterations for these three pages.


04 MID FIDELITY WIREFRAME
Designing The Medium Fidelity Wireframes Iterations
After sketching, I created medium fidelity wireframes to present the user experience and technical aspects of the platform in more detail. I mostly used existing Digital Fleet assets and designed some of them from scratch to save time and effort.
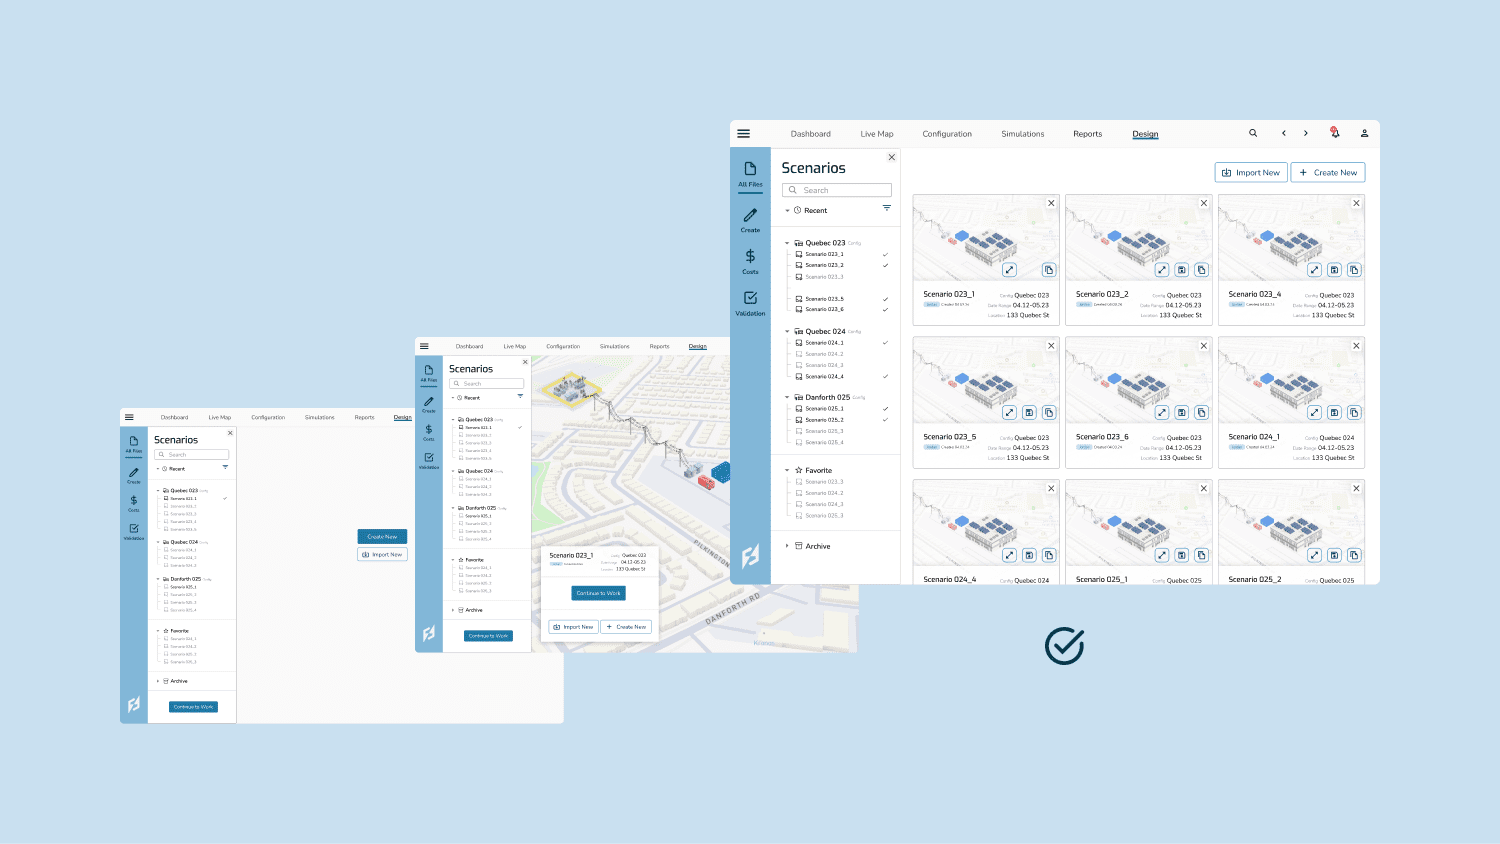
All Files Page
The images bellow are some iterations of the All Files page, where users can access all EV transition scenarios. After group discussions with DigitalFleets management and conducting user tests, the third iteration was selected for the following reasons:
ability to display multiple scenarios at a glance.
clear visibility of scenario details and images.
enhanced usability, supporting informed decision-making.
Create Page
Bellow are the images of three design concepts for the Create page, an AI-driven design workspace for engineers to blueprint EV transition solutions. The third design was selected based the following features:
intuitive access to the Suggestions and Regulation & Standards checklists.
streamlined commenting feature for efficient collaboration.
enhanced compatibility with the All Files page to ensure a cohesive user experience.

Costs Page
I developed three iterations for the Costs page, where users can estimate the cost of their designs. The third design was chosen based on the following criteria:
easy access to Scenarios via a built-in Scenario list.
a combination of the cards and table views to make cost analysis more straightforward.


05 PROTOTYPE & TEST
Creating High Fidelity Designs and Testing
After finalizing the medium fidelity design, I proceeded to create the high fidelity designs and the prototype and then conducted a user interview with 5 fleet design engineers to identify any UX pain points in the Design modules.
While all users were able to successfully complete the tasks, I found out the Suggestions checklist needed these revisions:
Error Count Tags: Each suggestion now includes a tag showing the number of related errors and giving users immediate visibility of issues.
Interactive Error Icon: Clicking the orange error icon highlights the corresponding item in the checklist with an orange hover effect, making it easier to locate and address errors.

Expanding the Component and Assets Library
Following the Design module's requirements, I created the new components and assets, added to the Digital Fleets’s library, and edited some of them based on the feedback received in user tests.


SOLUTION
📁 All Files Page
The "All Files" page allows users to manage their design projects efficiently. Users can continue working on previously started designs, create new designs or import existing ones.
Continuing a Previous Design: Users can effortlessly pick up where they left off by selecting a scenario marked with a pencil icon or choosing from the Recent Designs section.
Creating a New Design or Importing an Existing One: Users can start fresh or import a design by selecting a scenario from the Scenarios panel. On the right side, a preview and details of the chosen scenario will appear, providing all the necessary information before proceeding.

✏️ Create Page
The Design page enhances designs with valuable suggestions and regulatory policy guides, helping junior and senior resources work efficiently.
Suggestions Panel: A checklist of platform-generated suggestions marked by orange triangles. Hovering reveals their location on the design. Users can check off implemented suggestions by turning the triangle green.
Regulations and Standards Panel: A checklist of standards and regulations with links to relevant documents for compliance.
Energy Asset Icons: Display suggested locations of energy assets for imported designs.
Comment Feature: Allows users to leave comments on the design, accessible through the "Collaborate" button.

💰 Costs Page
The Cost Report section enables users to generate and review comprehensive cost reports for their design projects.
Dashboard Overview: Displays the total cost, scenario details, a cost breakdown into four categories, and a donut chart of cost distribution to provide users with a clear and quick view of costs.
Detailed Cost Table: Offers an in-depth look at each cost category.

Lessons Learned
I will write a sentence here
This was a very technical tool and relied on the capabilities of the software platform.
I leaned on my engineering lead as a partner to help me define how we could realistically build these features.
I learned how important it is to bring engineering into a project as early as possible.